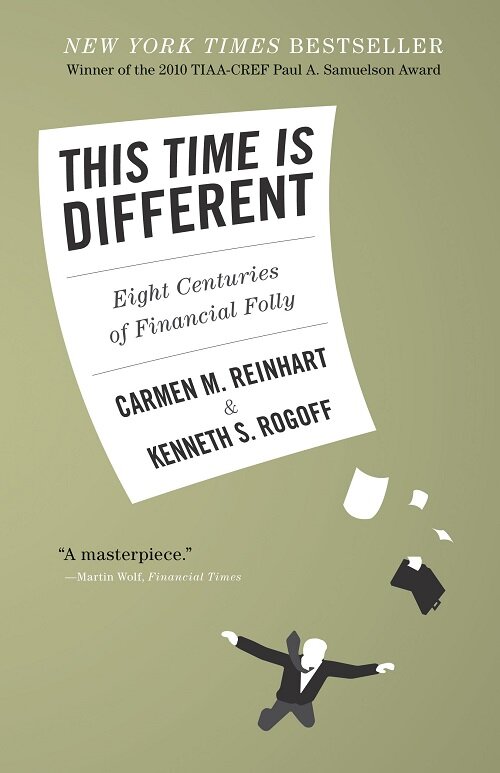
Carmen M. Reinhart & Kenneth S. Rogoff | Economics / Financial History | Read: December 2023
Why I Picked It Up
By late 2023, I was confused — and I don’t mean that casually.
The year before had felt like the beginning of the end. Inflation was running hot. The Fed was hiking at the fastest pace in decades. Crypto had imploded. In March 2023, Silicon Valley Bank collapsed in 48 hours, followed by Signature Bank and the forced rescue of Credit Suisse. For a moment, it looked like the reckoning had arrived.
Then the rally came back.
Within months, the same indices that had cratered were pushing toward all-time highs. Interest rates were still elevated. Earnings were only meeting lowered expectations. Sticky inflation refused to come down further. Regional banks had just blown up — and the market read that as a signal that the Fed would step in. The logic was circular: the worse things get, the more they’ll be rescued, so buy.
And then came ChatGPT. The AI boom handed Big Tech a new narrative. Nvidia went vertical. The Magnificent Seven dominated the S&P 500. No one had clear evidence that AI was boosting productivity yet — but that didn’t matter. The story was enough.
I was watching all of this as an active trader, and something kept nagging at me. Every bubble in history shares a common structure. I wanted to understand what that structure is, where the cracks always appear, and whether the toolkit exists to spot them before the collapse. That’s how I found Reinhart and Rogoff.
What It’s About
This Time Is Different is not a polemic. It’s a database.
Reinhart and Rogoff compiled financial crisis data spanning eight centuries and sixty-six countries — sovereign defaults, banking panics, currency crashes, inflation spirals — and laid them out side by side. The thesis is deceptively simple: financial crises follow recurring patterns, and the single most reliable predictor of the next one is the widespread belief that this time, things are different.
The “this time is different” syndrome works like this: a country (or an asset class, or an entire financial system) experiences a boom fueled by capital inflows and rising leverage. Experts produce compelling reasons why the old rules no longer apply — better institutions, smarter regulators, new financial instruments, structural shifts in the global economy. The debt keeps growing. Asset prices keep climbing. And then, with remarkable consistency, it all falls apart.
The book walks through this cycle in five arenas: sovereign external default, domestic debt crises, banking crises, currency debasement, and inflation — and across all five, the data just accumulates.
The Architecture of a Crisis
What struck me most was not any single chapter but the recurring anatomy of collapse. Reinhart and Rogoff show that crises — whether in 1820s Latin America, 1990s Asia, or 2007 America — share a strikingly similar skeletal structure:
Capital floods in. Foreign investors discover a “new” opportunity. Money pours into the country. Credit expands. Asset prices — especially real estate — begin to climb.
Leverage builds quietly. Domestic debt, often hidden or underreported, grows alongside external borrowing. Governments, banks, and households all borrow more than the headline numbers suggest. The authors make a crucial point here: domestic debt is the “missing link” that explains why countries default at seemingly low external debt levels.
The narrative takes hold. Each era produces its own version of “this time is different.” In the 1980s, it was petrodollar recycling and commodity supercycles. In the 1990s, it was Asia’s conservative fiscal policy and high savings rates. In the 2000s, it was financial engineering, securitization, and the idea that the United States — with its deep capital markets and sophisticated regulators — was simply too advanced to have a crisis.
The correction is brutal. Housing prices fall for four to six years on average. Government debt roughly doubles within three years of a banking crisis — not primarily because of bailouts, but because tax revenues collapse as the economy contracts. Unemployment rises by an average of seven percentage points over four years. And the pattern holds for both emerging markets and advanced economies. No one is exempt.
One finding that cut particularly deep: the United States showed an even steeper asset price run-up before 2007 than the average of history’s five worst financial crises. The market kept climbing precisely because of the Fed’s aggressive response to previous downturns. The “learning effect” — the belief that central banks had figured out how to prevent catastrophe — was itself part of the bubble.

The Trader’s Takeaway
What this book actually changed for me as a trader is the way I look at price action.
I came in looking for a framework to identify bubbles. I found one — but it came with a catch. The data shows that asset prices in the United States tend to keep rising right up until the moment of crisis. The combination of “safest investment destination” narrative and the implicit Fed put means that being early is indistinguishable from being wrong.
The authors document that U.S. equity markets outperformed even the most extreme pre-crisis comparisons in the years leading up to 2007. The crash, when it came, was violent. But the run-up was longer and more persistent than almost any historical parallel.
For a trader, this has a very specific implication: shorting a bubble is a losing strategy, even when you’re right about the bubble. The market can remain irrational — or rather, rationally irrational, given the backstop — far longer than your margin account can survive.
What the book actually teaches you to watch is not prices but plumbing: the flow of short-term capital, the ratio of external debt to GDP, and whether illiquid assets are being financed by short-term liabilities that keep getting rolled over. When the maturity mismatch becomes extreme enough, the question isn’t if but when.
After reading this, I started tracking three things more deliberately: the BCDI composite crisis index (banking, currency, debt, inflation), the ratio of foreign capital inflows to domestic output, and the direction of short-term capital flows. None of these will tell you the day the music stops. But they’ll tell you whether the band is playing faster than it should.
The Most Dangerous Sentence in Finance
The book’s power isn’t in any single data point. It’s in the pattern — the way every generation produces smart, credentialed people who explain, with genuine conviction, why the historical record no longer applies.
In the 1980s: commodity prices will stay high forever; bank lending has replaced bond markets, giving lenders better monitoring.
In the 1990s: Asian economies are different — high savings, conservative fiscal policy, no historical precedent for crisis.
In the 2000s: the U.S. has the most advanced financial system in the world; securitization distributes risk efficiently; developing countries need safe assets and will keep buying Treasuries indefinitely.
Each of these arguments was made by serious people with serious credentials. Each was wrong. Not because the logic was flawed in isolation, but because the logic was being used to justify an unsustainable level of debt — and debt, as the book demonstrates across eight hundred years, does not care about your narrative.
Final Thought
I read This Time Is Different in December 2023, right as markets were sprinting into year-end on the back of rate-cut expectations and AI euphoria. The timing was uncomfortably apt.
The book didn’t make me bearish. It made me careful. There’s a difference.
What Reinhart and Rogoff show is not that crises are inevitable tomorrow — it’s that the conditions for crisis build slowly, in plain sight, while everyone is busy explaining why the old rules no longer apply. The most dangerous moment is not when things look bad. It’s when things look so good that caution itself seems irrational.
As a trader, I took one rule away from this book above all others: don’t fight the current, but know where the waterfall is. Track the debt. Watch the capital flows. And when everyone around you is explaining why this time is different — that’s your signal to start paying very close attention.
Note: This review focuses on the book’s core argument and my personal response as a trader. The book covers an enormous amount of ground — sovereign defaults, domestic debt crises, banking panics, inflation spirals, and currency collapses across 66 countries and 800 years. If there’s interest, I may put together a separate reading notes series covering the historical evidence in detail.
Leave a Reply