At a Glance
10/10 · The clearest explanation I’ve read of why markets produce moves the standard models call impossible.
- Read it if: you trade or invest, or you are still hunting for a winning formula and want to understand why every method works only some of the time
- Skip it if: you want a ready-made trading method; this is a science book about how markets behave, and it leaves the rules to you
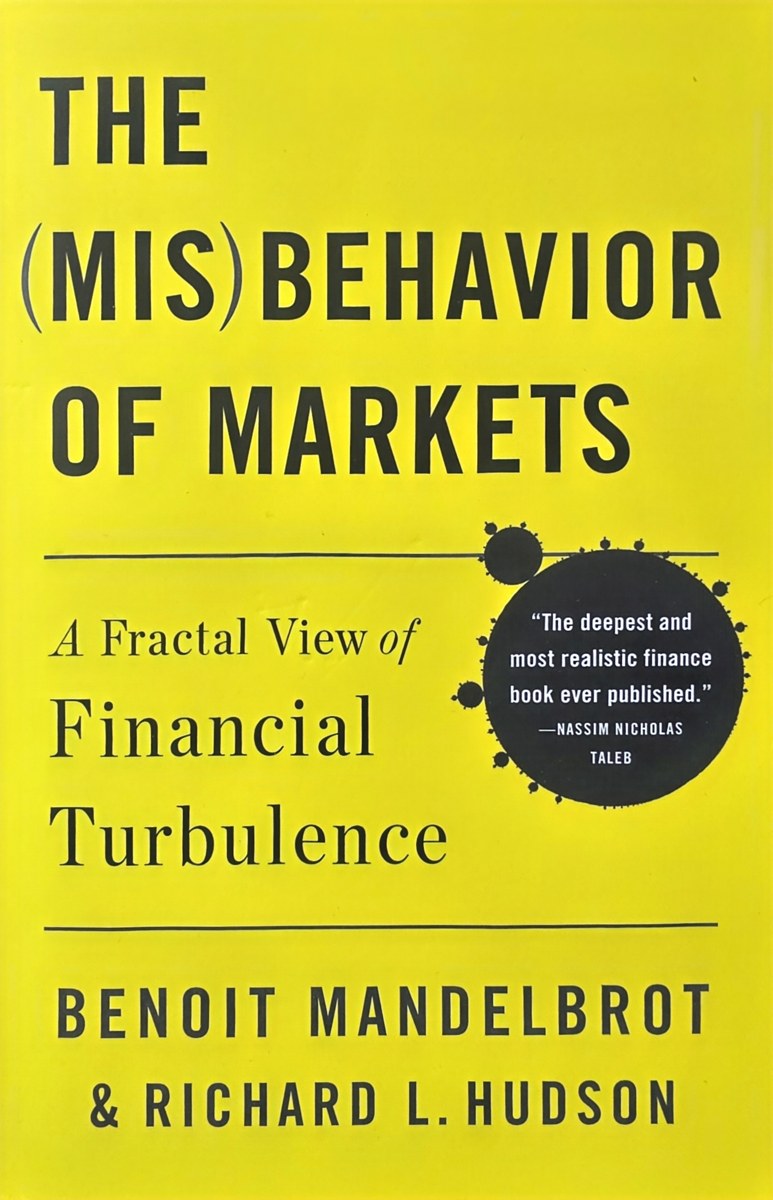
- The book: The (Mis)Behavior of Markets: A Fractal View of Financial Turbulence by Benoit B. Mandelbrot and Richard L. Hudson (Basic Books, 2006), 328 pages
- Read: November 2024 · in Korean translation
In November 2024 I was about to go back into crypto futures, and I kept circling a question most traders ask sooner or later: is there a holy grail, or is the whole thing a coin toss? The Misbehavior of Markets, Benoit Mandelbrot’s 2004 book written with Richard L. Hudson, gave me the most convincing answer I have found. Neither one.
Why I Picked It Up
Donald Trump had just won the election after promising to be America’s “crypto president,” and the mood in crypto was close to euphoric. Going back into futures in that market, I wanted to understand what I was actually trading.
My own screens kept sending mixed signals. From a distance, price looked like a random walk. Up close, I could see stretches where it followed a trend with something like rules. And then, every so often, a move would rip through anything a normal distribution would allow, up or down, and the market would enter territory no model on my desk was built for. I wanted to know whether those moves could be seen in advance, and why they happen at all.
The title also pulled me in for a more personal reason. Trading circles are full of fractal chart analysis, and I was in the middle of a physics PhD. A book that took fractals seriously, written by the mathematician who coined the word, was hard to resist.
The Korean translation is out of print, so I borrowed it from a library. I read it in the same few months as Per Bak’s How Nature Works and Neil F. Johnson’s Simply Complexity, and the three books kept talking to each other.
What The Misbehavior of Markets Argues
Modern finance rests on Louis Bachelier’s 1900 idea that prices follow a random walk. Mandelbrot shows that two of its core assumptions fail in real markets.
Price changes are not normally distributed. The tails are fat and follow a power law. Using the Dow from 1916 to 2003, the book shows the standard model expecting 58 days with moves above 3.4%, against 1,001 in reality. A one-day drop of more than 7% should come once in 300,000 years. Investors saw 48 of them in 87 years.
Price changes are not independent. Markets have long memory. Today’s move affects tomorrow’s, which is why momentum exists. Investors who lived through the Depression traded cautiously for decades, and Mandelbrot suggests that caution acted as a brake on the market well into the 1960s.
There are two kinds of randomness. Mandelbrot traces the word random back to a medieval French expression for a horse charging ahead so wildly that its rider can neither predict nor control it. Gauss’s “mild” randomness averages out. “Wild” randomness, the kind described by the Cauchy distribution, lets a single observation dominate the whole sample. Financial markets belong to the second kind.
From there he sets out how markets actually behave: markets are risky, trouble runs in streaks, markets have a personality, markets mislead, and market time is relative. He also lists the assumptions standard theory gets wrong: that investors are rational and identical, that prices move smoothly, and that they follow Brownian motion. The smooth-price assumption fails even at the level of the order book. By the book’s count, about 80% of price quotes end in 0 or 5.
Checking It Against Today’s Markets
The book’s data stops in 2003, before the 2008 crisis, the 2020 crash and the entire history of Bitcoin. Running the same comparison on daily data through October 2026 gives the picture below. Each market’s daily moves are scaled by its own volatility, so a 4σ day means a move four standard deviations from that market’s average day.
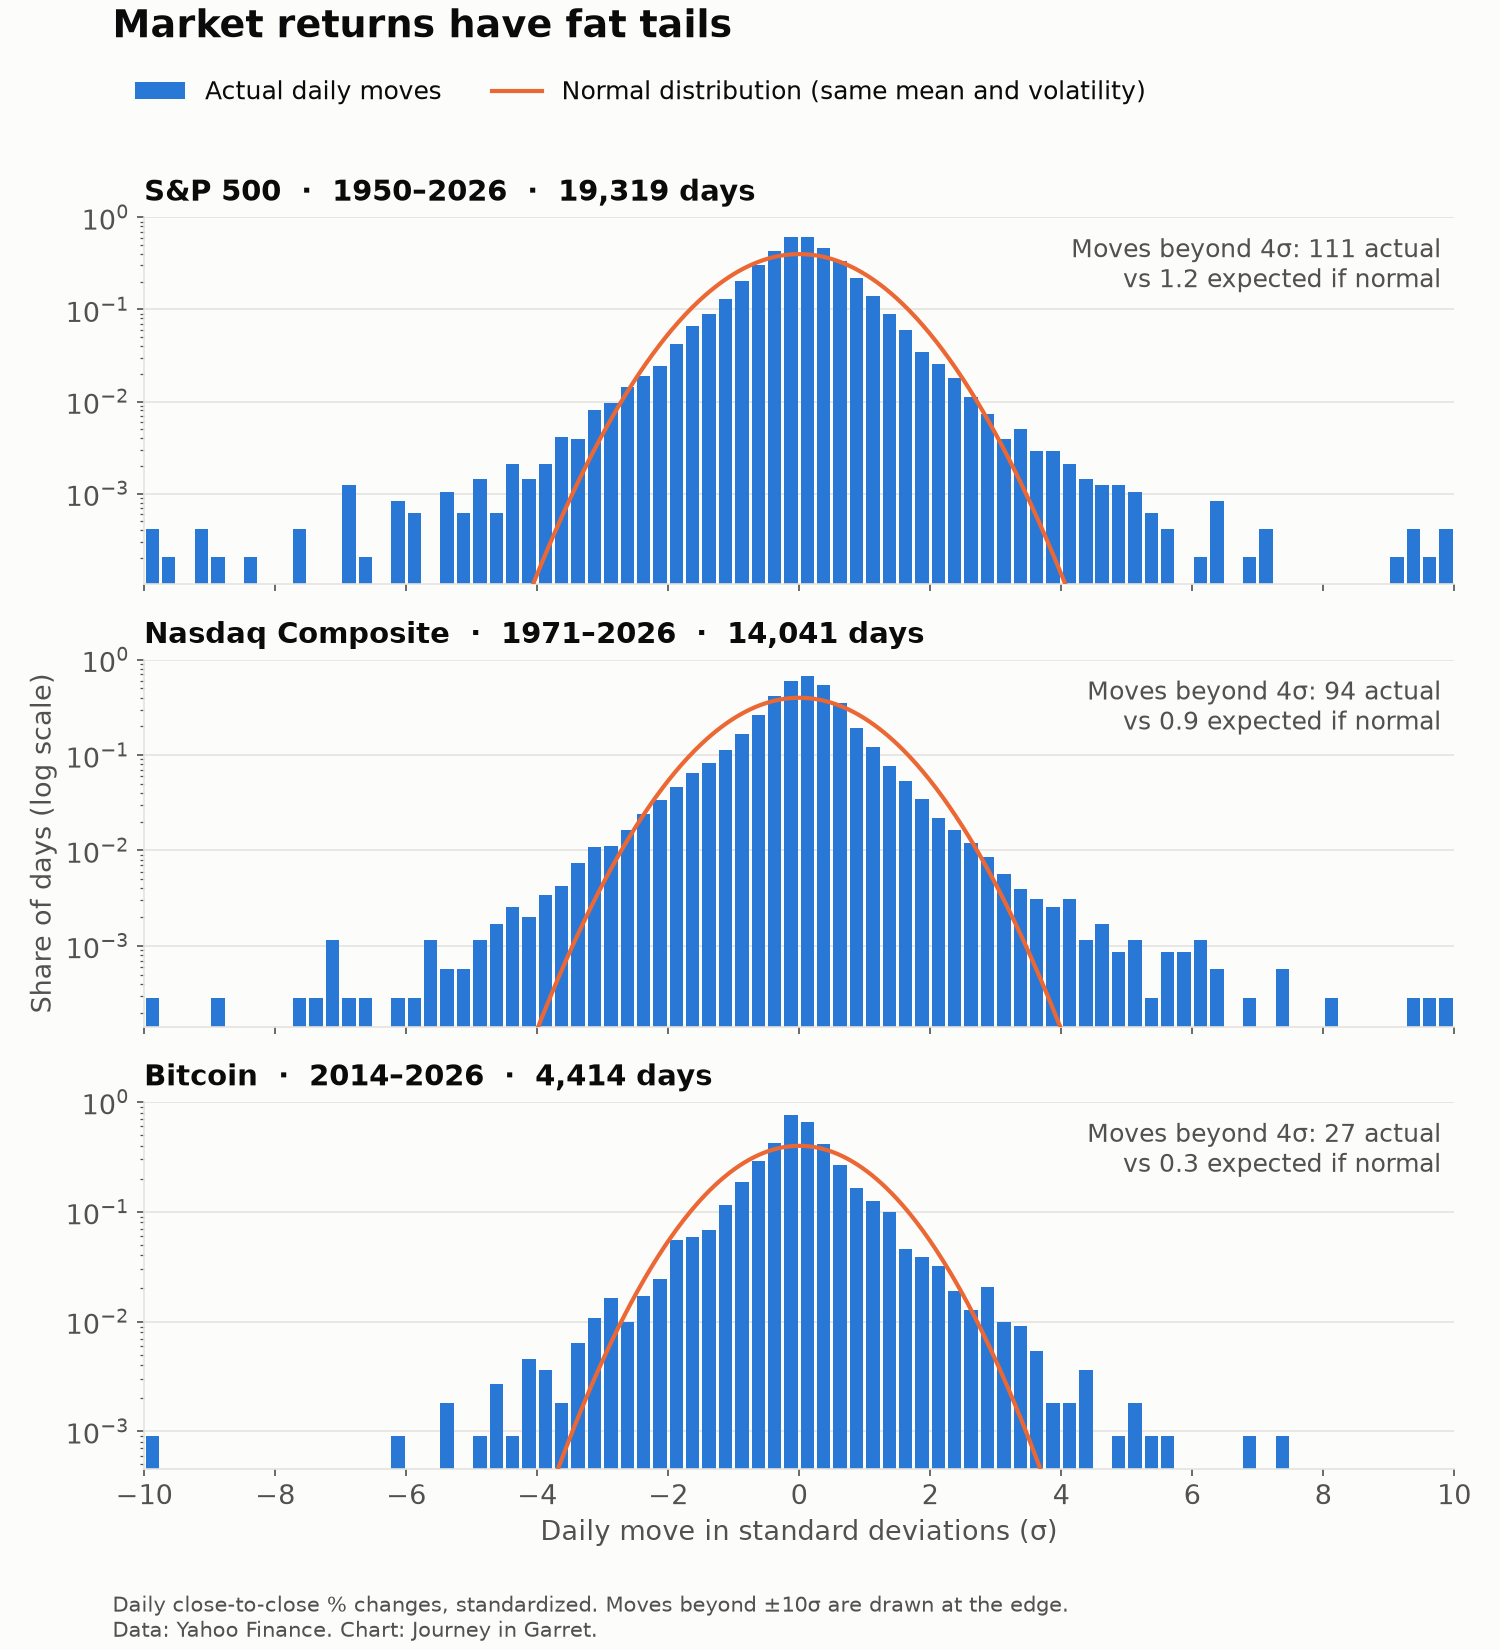
The orange curve is what the standard models assume. The blue bars are what happened. Near the center the two stay close. Out in the tails they part ways completely.
- S&P 500 (1950 to 2026): 111 days moved more than 4σ, where a normal distribution expects about one. Black Monday in October 1987, a 20.5% fall, was a 21σ day.
- Nasdaq Composite (1971 to 2026): 94 such days against an expected 0.9.
- Bitcoin (2014 to 2026): 27 such days against an expected 0.3, including a 37% drop on March 12, 2020.
The ratio stands out. In all three markets, moves beyond 4σ happen roughly 100 times more often than the bell curve allows. Bitcoin is about three and a half times as volatile as the S&P 500 day to day, yet once that volatility is scaled out, a market born in 2009 shows the same tail shape as a stock index measured since 1950.
Why It Reads Like Physics
What hooked me is that Mandelbrot treats these features as structural properties of the market, the same way a physicist treats the behavior of a complex system. Fat tails and long memory come from how the system is built, so they can’t be engineered away. Seeing him connect fractal geometry to price charts was the moment the book clicked for me. The roughness looks similar at every time scale because it comes from the same underlying process.
The book was also easier to read than I expected. It moves through the history of financial theory and the people behind it, and each idea comes with a market story. The final section, where he weaves long memory, fat tails, and fractal time into a single multifractal model, was the only part I struggled with. I respected that Mandelbrot names the weaknesses of his own theory and frames the work as a starting point for better portfolio construction, option pricing and risk management.
A Lesson for Formula Hunters
I don’t read this as a trading book, and I think its most useful audience is the people still searching for a winning formula. Whatever analysis you use, it tends to fit the market beautifully for a while and then stop working. To make it fit again, you have to widen the view or narrow it, much like a fractal that shows a similar structure only when you zoom in or out to the right scale.
The skill that follows is flexibility. A trader has to keep changing the frame as conditions change, instead of defending one method that matched one stretch of history. For anyone convinced the right answer is out there, this book can be a quiet lesson in humility. It made me see how much overconfidence sits inside the idea of a single correct method.
What I Took From It
The change in my trading is small but permanent. I mostly scalp and day trade, so I rarely hold overnight. When I do, I always place a protective stop against my position before going to sleep. The book convinced me that a move the models call impossible can show up on an ordinary night.
The larger change is in how I think about the holy grail question. If extreme moves are a property of the system, then trying to predict every one of them is the wrong goal. What a trader can control is surviving them. Finance has spent decades refining its tools on top of assumptions that don’t hold, and this book made me want to work on the foundations instead.
What I’m Still Wondering
The book came out in 2004. A large and growing share of trading now comes from algorithms, and increasingly from AI-driven systems. Do markets run mostly by machines still show the same complex-system behavior, or does that change it? I don’t have an answer yet. I bought the English original after returning the library copy, and it sits on my shelf waiting for a reread with that question in mind.
Read Next
- How Nature Works by Per Bak: the physics of self-organized criticality, which helps explain why complex systems produce events of every size.
- Simply Complexity by Neil F. Johnson: a clear, short introduction to complexity theory that makes Mandelbrot’s picture of markets easier to place.
- A Random Walk Down Wall Street by Burton Malkiel: the mainstream view Mandelbrot argues against. Reading both shows the debate from each side.
- This Time Is Different by Carmen Reinhart and Kenneth Rogoff: eight centuries of evidence that financial crises keep returning in the same shape.
Final Thought
This is one of the few books that changed what I think a market is. It gives you no system to follow. What it gives you is a more honest picture of the market you’re trading, and in a market where the impossible keeps happening, that picture is worth more than any indicator.
Leave a Reply