At a Glance
A clear explanation of how intangible assets change who wins, with less to say about what investors should pay for them.
- Book
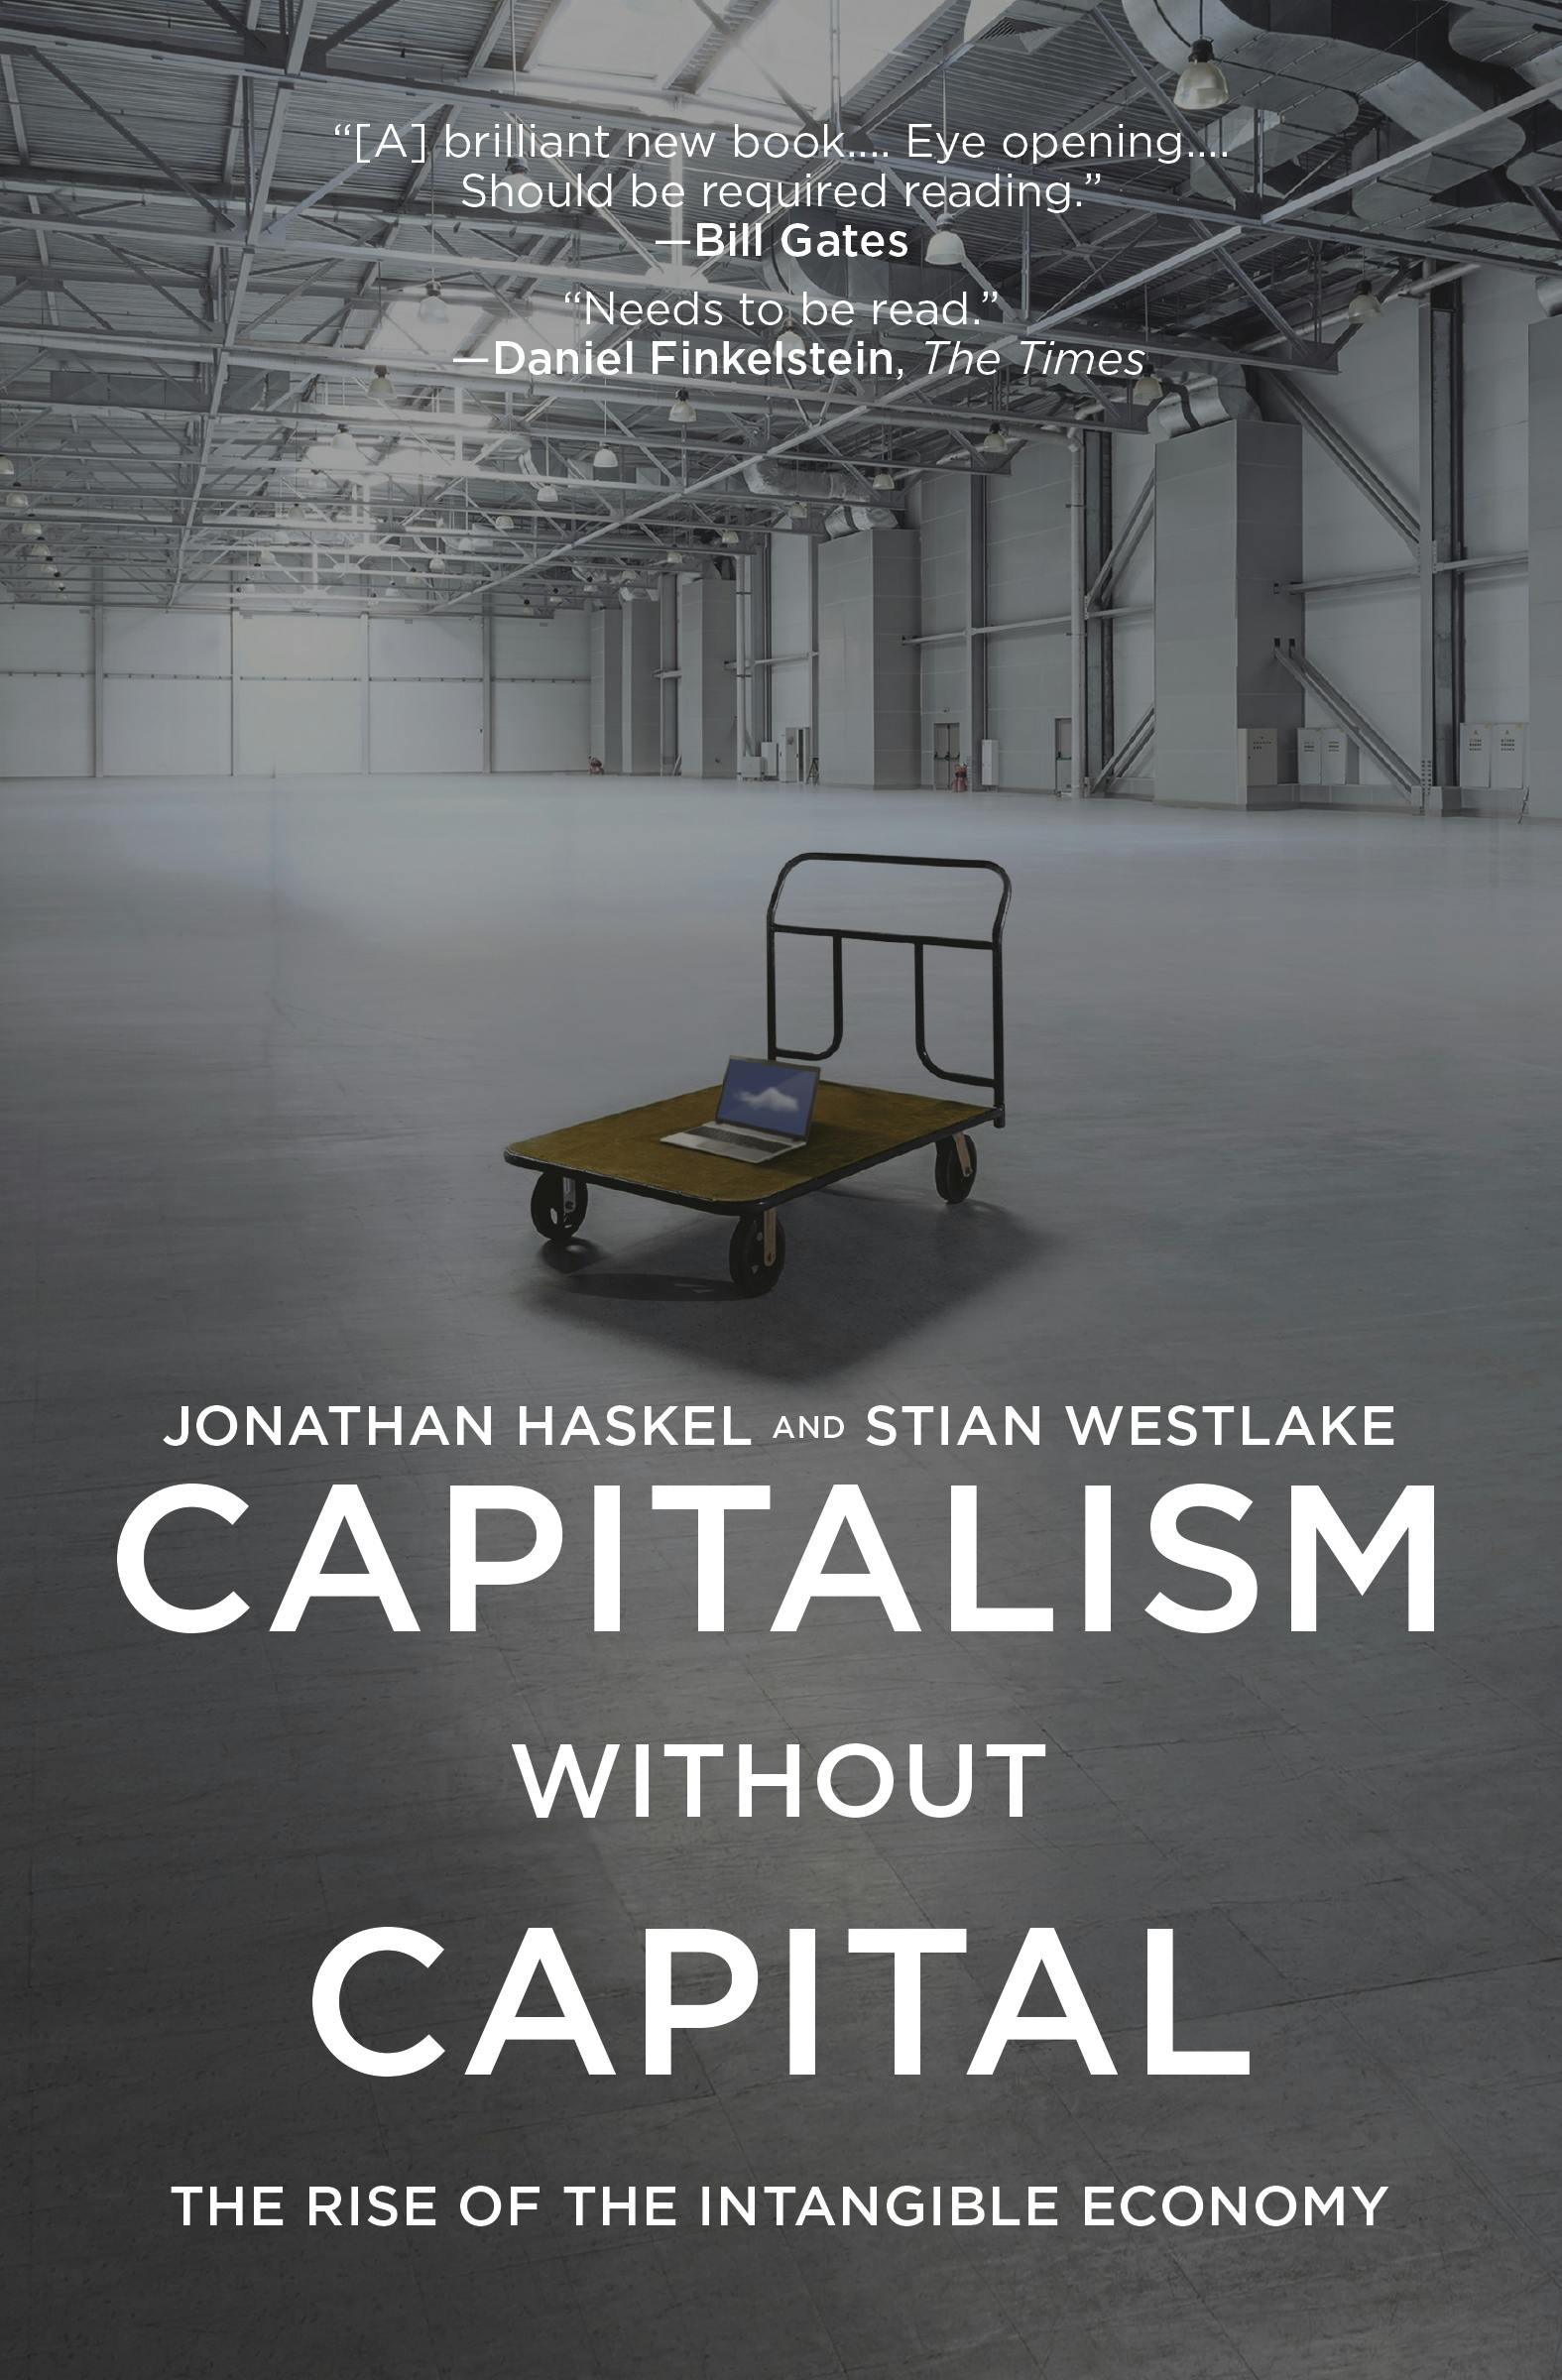
- Capitalism without Capital: The Rise of the Intangible Economy
- Authors
- Jonathan Haskel & Stian Westlake
- Original publication
- Princeton University Press, 2017
- Edition read
- Korean translation (Ecolivres, 2018), 384 pages
- Read
- March 2024
Read it if
You want to understand why companies with few factories can be worth so much, and why the leaders in an industry keep pulling away from the rest.
Skip it if
You want a valuation formula or stock picks. The book explains how the economy works and leaves company analysis to you.
At its peak in November 2021, Tesla was worth about $1.24 trillion. By my count from Yahoo Finance data, that was more than the next ten carmakers combined and close to three-quarters of 38 other listed carmakers put together, although Tesla sold only a small fraction as many cars. I couldn’t make the numbers work. Capitalism without Capital, by Jonathan Haskel and Stian Westlake, gave me a better question to start from: what are investors paying for when a company’s most valuable assets can’t be touched?
The book’s answer is that more and more of what companies invest in is intangible, and that intangible assets change how firms compete, borrow and grow. It helped me make sense of the valuations that puzzled me. It also left me with a question it doesn’t fully answer, which is how much those assets are worth.
Tesla against the other listed carmakers
Market value in US dollars · Nov 4, 2021 (Tesla’s 2021 peak) and Oct 26, 2026
Hover or tap a block or a name to see each carmaker. Keyboard: focus the chart, then use ← → to step through companies and ↑ ↓ to switch dates.
View the data table
| Company | Country | Nov 4, 2021 | Oct 26, 2026 |
|---|---|---|---|
| Tesla | United States | $1,235.2B | $1,548.0B |
| Toyota | Japan | $250.6B | $234.1B |
| BYD | China | $134.5B | $100.3B |
| Ferrari | Italy | $47.3B | $69.0B |
| General Motors | United States | $85.1B | $64.8B |
| Hyundai Motor | South Korea | $44.2B | $51.0B |
| Ford | United States | $77.6B | $46.2B |
| Honda | Japan | $53.2B | $44.6B |
| Mercedes-Benz | Germany | $107.4B | $43.4B |
| Porsche AG | Germany | not listed | $42.5B |
| Volkswagen | Germany | $134.8B | $38.8B |
| BMW | Germany | $68.0B | $38.5B |
| Maruti Suzuki | India | $31.4B | $37.2B |
| Mahindra & Mahindra | India | $14.6B | $36.1B |
| Kia | South Korea | $29.6B | $30.9B |
| Suzuki | Japan | $23.1B | $25.7B |
| Geely Auto | China | $33.1B | $19.6B |
| SAIC Motor | China | $37.7B | $18.7B |
| Chery | China | not listed | $17.4B |
| Rivian | United States | not listed | $16.6B |
| Hyundai Motor India | India | not listed | $16.0B |
| Great Wall Motor | China | $74.0B | $15.3B |
| Stellantis | Netherlands | $63.8B | $11.8B |
| Subaru | Japan | $15.5B | $11.7B |
| Li Auto | China | $33.1B | $11.1B |
| Seres | China | $14.5B | $10.8B |
| Changan Auto | China | $21.5B | $10.7B |
| Tata Motors (passenger vehicles) | India | $21.8B | $10.2B |
| XPeng | China | $40.9B | $8.7B |
| Renault | France | $10.9B | $8.4B |
| NIO | China | $70.7B | $8.2B |
| VinFast | Vietnam | not listed | $7.1B |
| JAC Motors | China | $4.7B | $6.8B |
| GAC Group | China | $22.9B | $6.2B |
| Leapmotor | China | not listed | $6.1B |
| Nissan | Japan | $20.8B | $6.0B |
| Mazda | Japan | $5.9B | $4.4B |
| BAIC BluePark | China | $8.4B | $4.1B |
| Volvo Cars | Sweden | $20.8B | $3.2B |
| Mitsubishi Motors | Japan | $4.9B | $3.0B |
| Tofas | Türkiye | $3.1B | $2.2B |
| Jiangling Motors | China | $1.6B | $2.1B |
| Lucid | United States | $60.0B | $1.3B |
| Brilliance China | China | $4.7B | $1.1B |
| Voyah | China | not listed | $0.7B |
| BAIC Motor | China | $2.9B | $0.7B |
| Polestar | Sweden | not listed | $0.6B |
| All others combined | $1,699.7B (38) | $1,153.8B (46) | |
| Tesla ÷ all others | 0.73× | 1.34× |
Why I Picked It Up
Tesla’s valuation was hard to defend on the measures I knew how to read. Delivery waits were long, complaints about quality were common, and its sales were small next to the incumbents’. Calling it a bubble was the easy answer, and enthusiasm for Elon Musk surely played a part.
The rest of the market made that answer feel incomplete. The largest companies in the stock market were being valued differently from the industrial champions of earlier decades. Those older companies owned large amounts of plant and equipment, borrowed against it, and carried high debt. Investors had well-worn ways of valuing them, and unless one of them had a real breakthrough to show, the market rarely rewarded it. Some looked undervalued to me.
I read Capitalism without Capital in March 2024 to understand what sat behind that difference.
What Capitalism without Capital Argues
Haskel and Westlake start with spending that leaves nothing physical behind: research and development, design, software, data, brands, training, and the routines that let a company’s people work well together. If that spending keeps paying off for years, they argue, it is investment in the same sense as a new machine. By at least one measure, this kind of investment overtook investment in buildings and equipment in the United States by the mid-1990s.
Company accounts were built for the older kind. One of the book’s examples is Microsoft in 2006, when its plant and equipment came to about 1 percent of its market value. The accounting also treats the same kind of asset in two ways. A brand or technology bought from another company goes on the balance sheet, while one built in-house is mostly expensed, so firms that invest heavily in their own intangibles can look less profitable and less asset-rich than they are.
The heart of the book is four properties that make intangible assets behave differently, which the authors call the four S’s. They illustrate them with EMI, the record company that used profits from the Beatles to fund the development of the CT scanner.
- Scalability. An intangible can be used over and over at little extra cost. A recording can be pressed in endless copies, and software or a brand can serve any number of customers.
- Sunkenness. Intangibles are hard to sell if things go wrong, because much of their value exists only inside the company that built them. When EMI left the scanner business, it recovered very little of what it had put in.
- Spillovers. Others can benefit from an investment they didn’t pay for. GE and Siemens built large scanner businesses using technology EMI had developed.
- Synergies. Ideas become more valuable in combination. The scanner came out of EMI’s work in computing, imaging and electronics, combined with medical knowledge.
Scalability and synergies make intangibles a source of large gains. Sunkenness and spillovers mean an investment can return nothing to the company that made it, which is what happened to EMI.
From these properties the book builds a larger argument. Banks lend against collateral, so an economy rich in intangibles needs more equity and less debt. Large firms can scale their intangibles and absorb other firms’ ideas, so the gap between leaders and laggards grows. The authors connect this to slower productivity growth after the financial crisis and to rising inequality, from pay gaps between firms to house prices in thriving cities, and they close with policy proposals on intellectual property, urban planning and finance.
Why the Leaders Pull Away
The part that stayed with me longest was the competition between leading firms and everyone else.
If ideas spread and can be reused at almost no cost, smaller firms should benefit. Turning an idea into a business takes much more than the idea, though: a brand customers trust, people who can improve the product, a way to reach buyers, and enough money to survive until it pays. A company that already has those assets can attach a new idea to them. Its data improves its algorithms, and new products reach customers through a brand and a distribution network it built years ago. A newcomer has to prove the idea and build everything around it at the same time. Two firms can get hold of the same idea and still start from very different places.
Money widens the gap. A leader with a profitable core business can fund its next experiments from its own cash, while a newcomer has to persuade outside investors first. Intangibles make that persuasion harder. A bank wants something it can sell if a loan goes bad, and a team’s know-how or software written for one company does not qualify. The book shows that industries heavy in tangible assets borrow more, while intangible-intensive industries rely more on equity and venture capital. That matched what I had noticed about the old industrial champions, which borrowed heavily against their factories. A later OECD study found that tighter financing conditions weigh more on productivity growth in intangible-intensive industries.
What bothered me most was the order of events. A company needs a convincing outlook to raise money, and it needs money to produce the results that make the outlook convincing. A firm that already has a brand, a sales network and cash flow gets through that loop far more easily. Explaining the gap only through managerial talent or entrepreneurial drive misses how much the starting position matters.
Spillovers do not reliably favor the small firm either. The book argues that companies with the right people and organization are better at absorbing what others discover, and that when the largest firms capture those spillovers, smaller rivals see less reason to invest. The authors suggest this may help explain why returns at the top stayed high while overall investment and productivity growth weakened. A later study co-authored by Haskel found that productivity gaps within industries widened more after 2000 where intangible investment grew faster, with the gains at the top linked to the scalability of intangibles.
What AI Adds to the Story
Two developments in AI since I read the book pull in opposite directions. The first changed my mind about part of the book’s argument. The second fits it closely.
When I read the book, I agreed that spillovers mostly help the leaders and that a newcomer would struggle to overturn them. DeepSeek made me less sure. It released its V3 model at the end of 2024 and its R1 reasoning model in January 2025. The V3 technical report put the cost of the final training run at about $5.6 million in rented GPU time, a figure that excludes earlier research and experiments. In DeepSeek’s own evaluation, R1 scored 79.8 percent on the AIME 2024 math benchmark, against 79.2 percent for OpenAI’s o1. One benchmark says little about performance across tasks, and a training-run figure is not the cost of building a model. Still, it showed that a huge head start in spending does not always buy a matching lead in performance.
DeepSeek built on published research and open models, then distilled R1 into smaller models based on Alibaba’s Qwen and Meta’s Llama and released those as well. Knowledge that others had paid to create became the challenger’s weapon. It looked to me like a counterexample to the book. Spillovers can entrench a leader, and they can also hand a challenger that is able to absorb them a way to catch up.
Catching up on a model is only the first hurdle. Customers, distribution and revenue come after it, and none of them arrive with a benchmark score.
The second development is the return of physical capital. Next to every story about catching up on algorithms runs a race for GPUs, high-bandwidth memory, data-center sites and electricity. In fiscal 2026, which ended in June, Microsoft generated about $182.9 billion of cash from operations and spent about $115.9 billion of cash on property and equipment. That figure covers the whole company, and Microsoft ties its spending to building data centers for cloud and AI demand. Code costs almost nothing to copy, yet serving a model to millions of customers runs on chips and power.
This is where the book’s title starts to sound ironic, although its idea of synergy explains what is happening. The book notes that intangibles like software and data grew on the back of computers. Today a model, its data and its customers become far more valuable when the same company controls the computing and power to serve them. When firms that have already built up intangibles also secure that infrastructure, the barrier to entry rises. Spillovers can lower the cost of building a model. They do far less for the cost of distribution and data centers.
Technology can be copied faster than a profitable business can be built, which is why I read DeepSeek’s progress and Big Tech’s spending as one story. How that spending is financed is a separate risk, one I looked at in my review of This Time Is Different.
Where It Stops Short
Back to Tesla. With intangibles in the picture, factories and unit sales are clearly not enough to value a company like that. Technology, brand and organization create value too. Knowing which assets matter still doesn’t tell me what to pay for them. How much will the technology earn, how fast will competitors catch up, and how much more equipment and money will it take to serve customers? A great asset can still carry too high a price. The book itself points out that intangibles are hard to value, which makes over-optimism and overinvestment easy.
As an investor, I wanted the next step: how to find companies that invest heavily in intangibles from public filings, and how to compare one with another. The book does offer investors some guidance. It explains that expensed intangible investment makes reported profits look smaller, that serious research and a judgment of management matter more in this economy, and that spillovers make a case for owning a broad spread of companies. It stops before a method I could apply to a list of stocks. I came away understanding the structure of competition much better, with the work of narrowing it down to actual investments still ahead of me.
What I Took From It
The first question I ask about a company has changed. I used to start with what it owns. Now I start with what it has built, how long that will keep earning, and how much physical spending it needs to serve customers at scale.
It also changed where I look. The leaders’ advantages make them look like the safer holding. Still, if I can spot smaller companies that manage to break out of the funding loop and keep growing, I think they deserve a place next to the leaders.
Final Thought
Capitalism without Capital explained what my Tesla puzzle was about. More and more of what companies own can’t be seen on a factory floor or fully on a balance sheet, and those assets tend to reward the firms that already have the most of them. I would recommend it to anyone who wants to understand where a company’s edge comes from once factories no longer explain it.
Recognizing invisible value and accepting the price attached to it are still two separate decisions for me. The book showed me what to examine between them.
Read Next
- Power and Progress by Daron Acemoglu and Simon Johnson: once you have seen why some firms pull away, this book asks who directs technology and whether its gains reach anyone beyond the winners.
- This Time Is Different by Carmen Reinhart and Kenneth Rogoff: eight centuries of evidence on how borrowing turns booms into crises, useful for judging how the AI build-out is financed.
Leave a Reply